See Every AI Tool, Session, Token, and Dollar
Real-time visibility across the fleet: which AI tools run where, what each session actually did, where the data went, and what all of it costs.
Six Capabilities, One Telemetry Stream
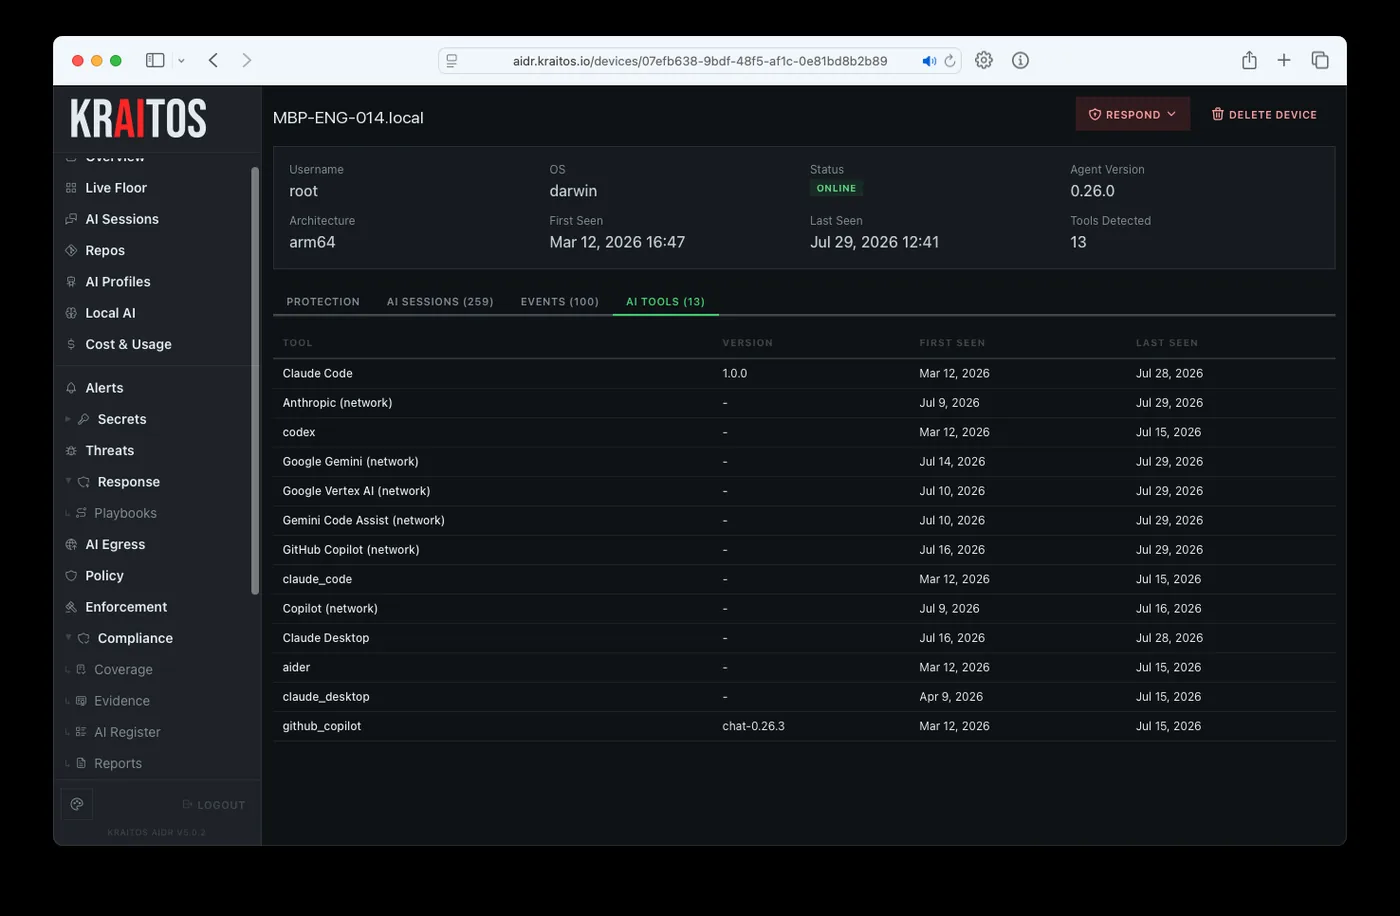
AI Tool Discovery
Five independent detection layers identify AI coding tools by name, by network destination, and by behavior - catching tools that have no signature yet.
- 14 tools by name
- 25+ cloud APIs
- Behavioral heuristics
- WSL coverage
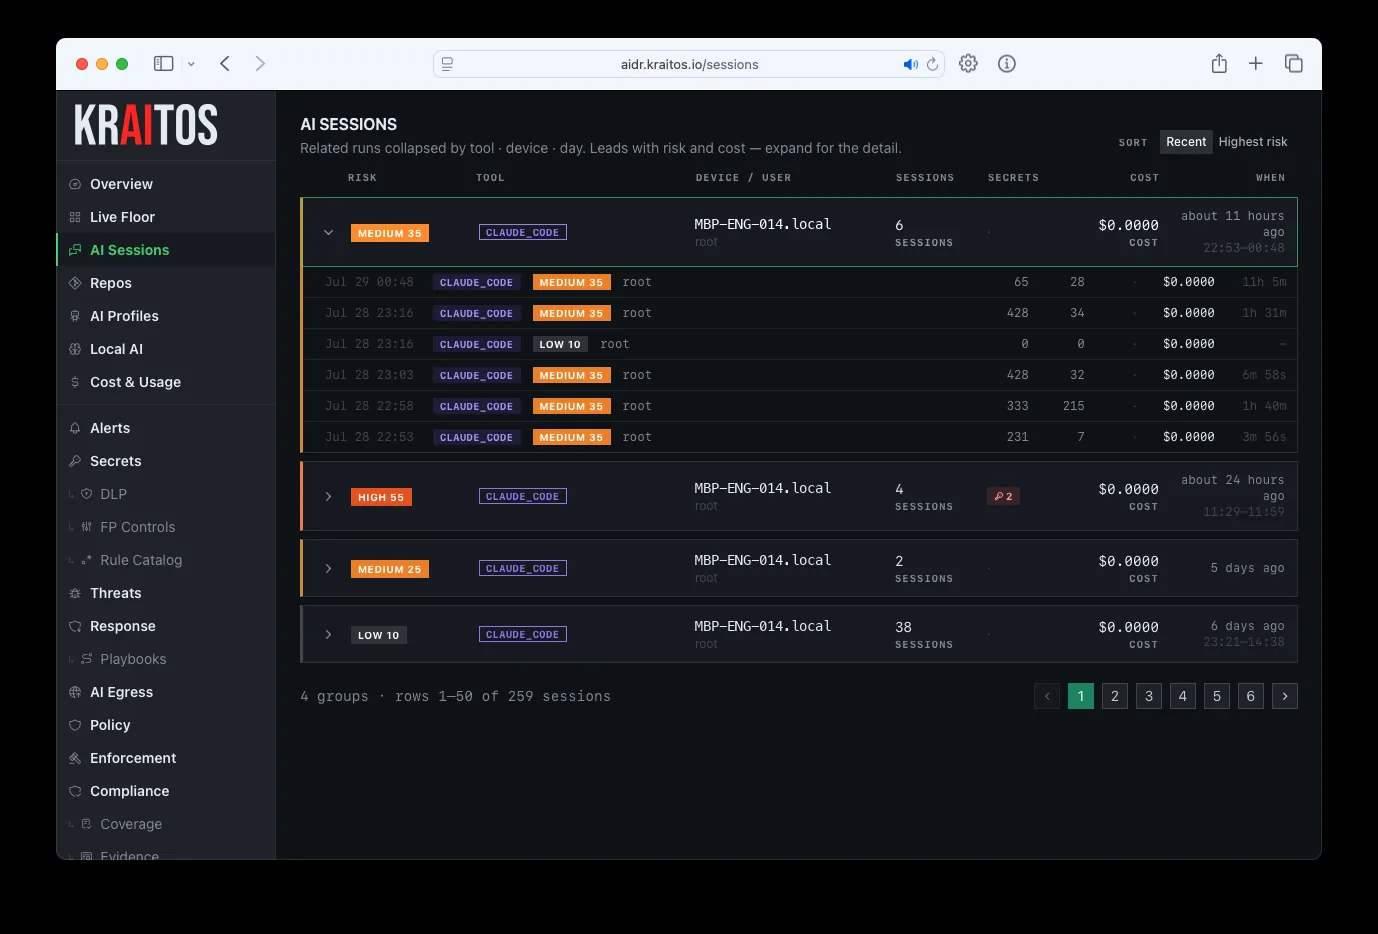
Session Intelligence
Full Claude Code session reconstruction: prompts, responses, tool calls, file operations, shell commands, MCP connections, and per-turn cost.
- Conversation replay
- Shell command log
- Subagent mapping
- Cost per turn
Live Floor
Every active AI session across the fleet in real time - who is running what, in which repo, on which model, with live token burn.
- Sub-second streaming
- Per-repo context
- Model visibility
- Live token burn
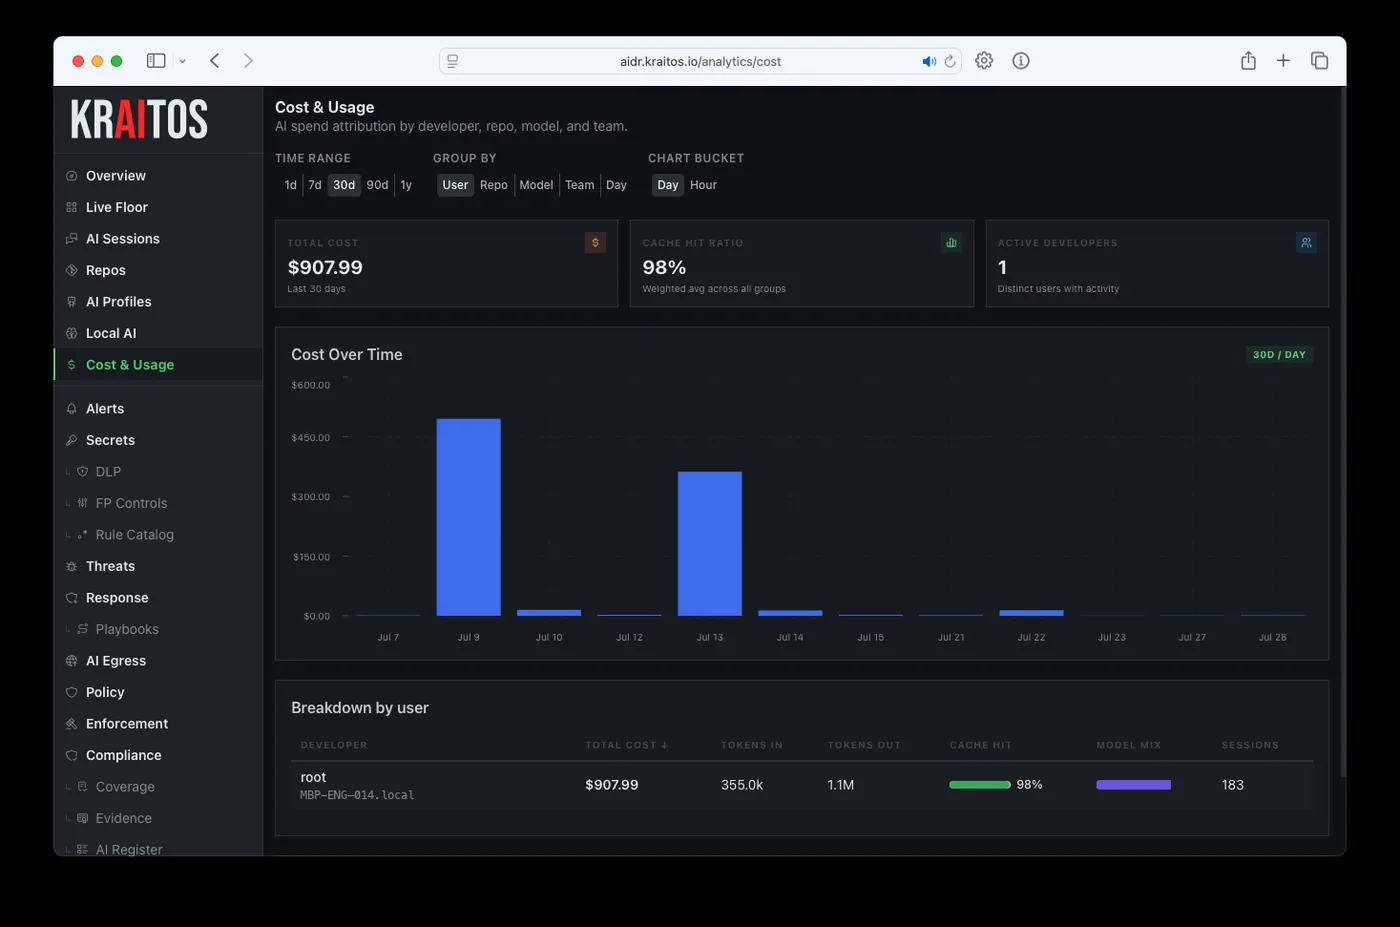
Cost & Usage Analytics
Per-developer, per-team, per-model token and cost tracking with 30-day trends, budget alerts, and chargeback-ready exports.
- Model-aware pricing
- Budget thresholds
- Adoption metrics
- Finance exports
Local AI Detection
Self-hosted inference that never touches the corporate network is still inventoried - model name, size, quantization, and last-used time.
- Ollama
- LM Studio
- vLLM
- llama.cpp +3 more
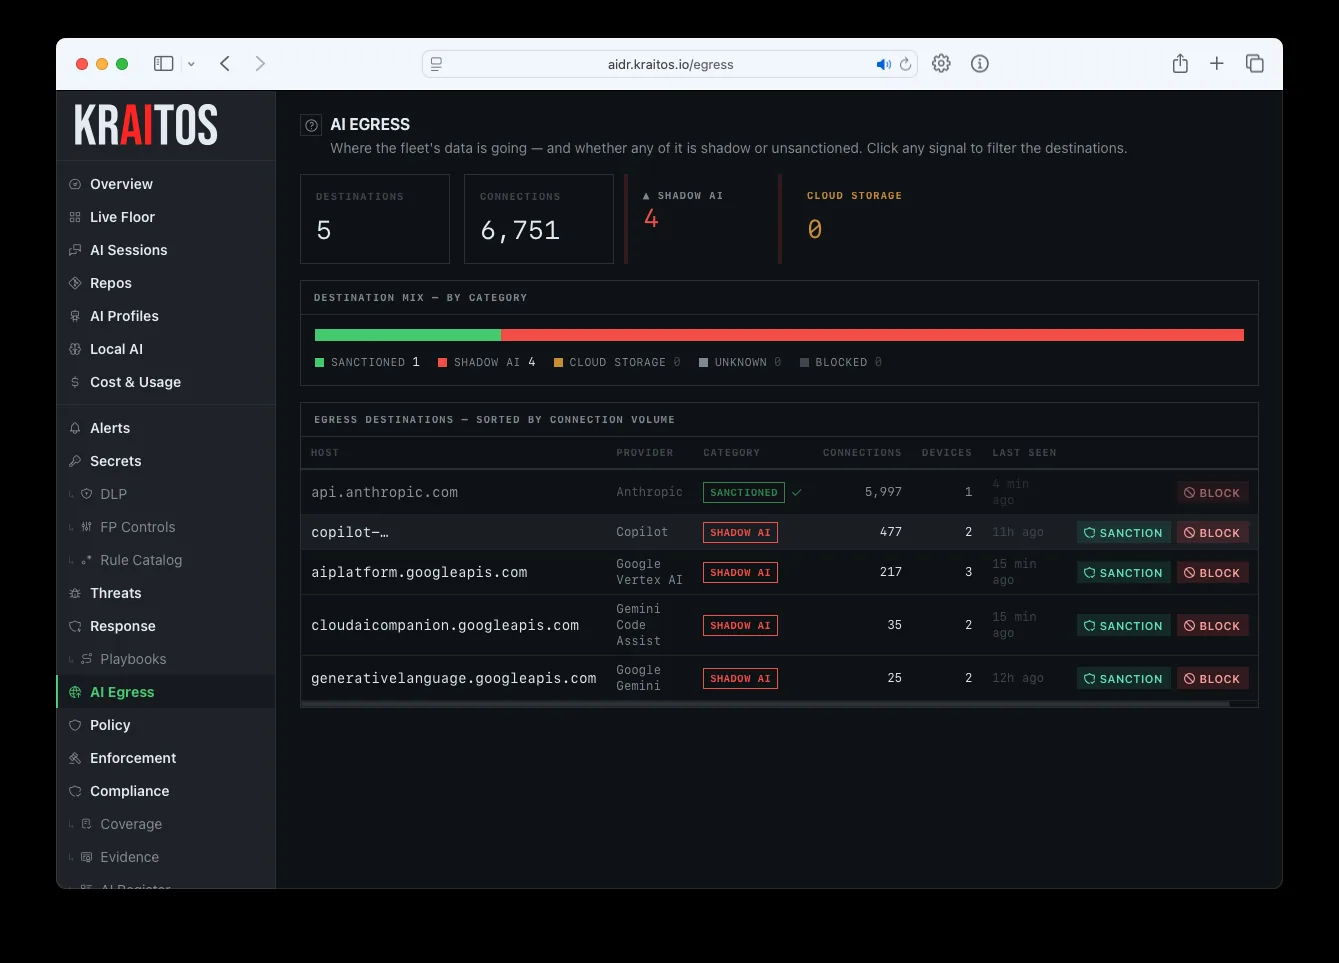
Data Egress Monitoring
Every AI-related outbound connection classified into five categories, with connection history and one-click reclassification.
- Shadow AI flagging
- MCP destinations
- Reclassification
- Policy integration
The Five Layers
| Discovery | Filesystem scanning for config directories, VS Code and JetBrains extensions, and process names - 14 AI tools detected by name |
| Network | Connection monitoring identifies 25+ cloud LLM APIs and 7 local inference servers by destination |
| Behavioral | Behavioral heuristics recognize how AI tools act - catching unknown and custom tools no signature list has heard of |
| Telemetry | Deep session telemetry for Claude Code - full conversation replay, token tracking, MCP visibility |
| Dependency | Dependency monitoring across 9 package formats, with known vulnerabilities flagged automatically |
The Monitoring Surface
From Endpoint to Dashboard
- Step 01
Collect locally
The agent observes AI tools, sessions, connections, and dependencies on the endpoint itself.
- Step 02
Stream securely
Telemetry streams over an encrypted, mutually authenticated channel, buffered locally and replayed on reconnect - an offline laptop loses nothing.
- Step 03
Process and attribute
The ingestion service maps activity to user, team, device, repo, and model, then prices it.
- Step 04
Surface in seconds
Sessions appear on the Live Floor with sub-second latency; inventory refreshes on its own cadence.
Controls This Pillar Satisfies
- NIST CM-8
- System component inventory - AI tools, software, hardware, and extensions
- NIST SI-4
- System monitoring - continuous behavioral and network monitoring
- ISO A.8.16
- Monitoring activities across every endpoint
- SOC 2 CC7.2
- System monitoring with real-time alerting
See Kraitos AIDR in Action
Deploy in 60 seconds. Get answers in 24 hours. Stop guessing what your AI-augmented organization is doing.
[email protected]kraitos.io